24 answers about checking app revenue, downloads, in-app purchases and subscription earnings - read by people across 92,706+ app checks.
What is an app revenue checker? ⌄
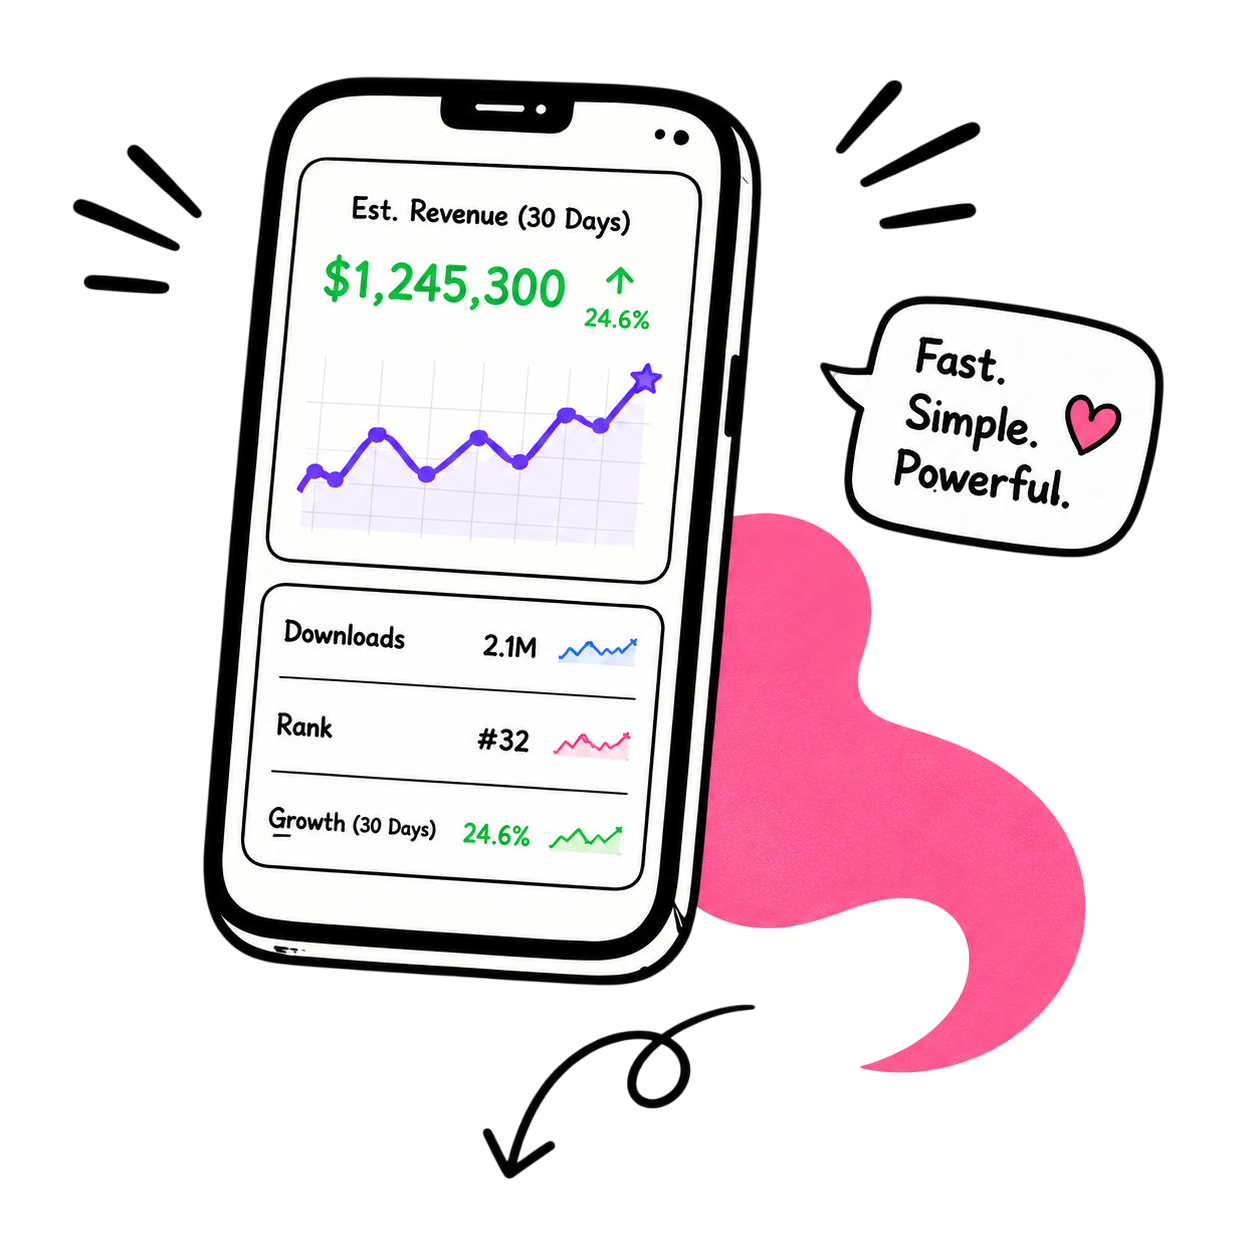
An app revenue checker estimates how much money a mobile app makes from public app store data - App Store grossing rank, Play Store install ranges, ratings, reviews, in-app purchases, subscription pricing, ad monetization signals and category ARPU benchmarks. Rev.now is a free app revenue checker that returns monthly recurring revenue (MRR), annual revenue (ARR), download estimates, paying-user counts and the full revenue mix (subscriptions vs IAP vs ads vs paid downloads) for any public iOS or Android app.
How do I check app revenue for any app? ⌄
Paste an App Store or Google Play link into Rev.now (or just type an app name). The app revenue checker pulls live public store data - grossing rank, install ranges, scraped subscription prices, in-app purchase tiers, ad monetization signals - and returns estimated monthly revenue, annual revenue, lifetime revenue, download estimates, MAU and the monetization model breakdown.
Can I check app revenue for free? ⌄
Yes. Rev.now is a 100% free app revenue checker - no sign-up, no API key, no credit card, no rate limits for normal use. You can check estimated revenue, in-app purchase earnings, subscription revenue, ad revenue, downloads and rankings for any public iOS or Android app on the App Store or Google Play.
How does Rev.now estimate App Store revenue for iPhone and iPad apps? ⌄
For iOS apps, Rev.now combines App Store grossing rank, ratings velocity, scraped subscription prices, in-app purchase tiers, monetization model, category ARPU benchmarks and the standard 1:75 ratings-to-downloads ratio (Apple does not publish App Store download counts). The output is monthly App Store revenue, paying-user share, subscription revenue, IAP earnings and ad revenue - net of Apple's 15–30% store cut.
How does Rev.now estimate Google Play revenue for Android apps? ⌄
For Android apps, Rev.now uses Google Play install ranges (1M+, 10M+, 100M+ etc.), grossing rank, ratings, scraped subscription pricing, in-app purchase price ranges and category ARPU benchmarks. Play Store install data is more transparent than App Store data, so download estimates are usually tighter - and we still report subscription revenue, IAP earnings, ad revenue and paid-download revenue separately, net of Google's 15–30% Play Store cut.
Can I check both iOS and Android app revenue for the same app? ⌄
Yes. iOS and Android pages are separate (distinct URLs, distinct keyword targeting), but you can paste both store links into the homepage tool to get a combined cross-platform estimate that adds App Store revenue + Play Store revenue. iOS users typically convert to paying users at 2–3× the rate of Android users, so the per-platform breakdown matters.
How accurate are these app revenue estimates? ⌄
App revenue estimates are directional - typically within 2–3× of actual money earned for popular apps. Rev.now uses public store signals (downloads, grossing rank, IAP tiers, subscription pricing, ratings) plus category ARPU benchmarks, but cannot see private Apple App Store Connect or Google Play Console data, exact paying-user counts, refunds, ad fill rate or geography mix.
Does Rev.now show exact App Store or Play Store revenue? ⌄
No. Rev.now shows estimated revenue, estimated in-app purchase earnings, estimated subscription revenue and estimated ad revenue - not exact private financial data. Exact app revenue, payouts and paying-user counts are only available through verified first-party data from the app developer (App Store Connect, Play Console).
What public data does Rev.now use to estimate app revenue? ⌄
Rev.now uses entirely free public app data: App Store and Google Play listing pages, scraped subscription tiers and free trials, in-app purchase price ranges, install ranges (Android), ratings and reviews, grossing rank, category rank, country charts, monetization model signals, ad-revenue eCPM benchmarks and category-level ARPU benchmarks. No private API access, no leaked data.
Can Rev.now show the parent brand or company revenue too? ⌄
Yes. For apps where most of the money is earned off-store - Binance, Uber, Airbnb, Coinbase, Robinhood, DoorDash, Stripe, Spotify and others - Rev.now attaches the parent brand's reported corporate annual revenue from public filings (SEC 10-K, 20-F, annual reports) so you see both numbers: the in-app revenue (subscriptions, IAP, ads) and the full brand revenue (trading fees, ride commissions, hotel bookings, payment processing, enterprise contracts, etc.).
Do I need to sign up to use the app revenue checker? ⌄
No. Rev.now is free with no sign-up, no email capture, no paywall and no credit card required. Paste an App Store or Play Store link, or search by app name, and check the estimated revenue, downloads, in-app purchases, subscription pricing and monetization mix instantly.
How accurate are the app revenue and earnings estimates? ⌄
Estimates are directional - typically within 2–3× of actual money earned for popular apps. We compute a central figure using public App Store and Google Play data (downloads, grossing rank, ratings, scraped subscription pricing, in-app purchase tiers) combined with category ARPU benchmarks for ad revenue and IAP, then show a low–mid–high confidence band. Real revenue depends on geography, retention, ad fill rate, refunds and other private factors Apple and Google never publish.
What store links can I use to check app revenue? ⌄
Any App Store URL (apps.apple.com/...) or Google Play URL (play.google.com/store/apps/details?id=...). You can also paste a bare iOS app ID (e.g. 389801252) or Android package name (e.g. com.spotify.music). Both stores are supported and each gets its own SEO page with revenue, downloads, in-app purchases and subscription pricing.
How often is the App Store and Play Store data refreshed? ⌄
Each lookup fetches live data from the App Store or Google Play in real time - grossing rank, install ranges, ratings, scraped subscription tiers and in-app purchase prices. Results are cached for one hour to be polite to the stores and keep response times fast.
Can I check competitor app revenue, in-app purchases and subscriptions? ⌄
Absolutely. Paste a competitor's App Store or Play Store link to instantly see their estimated monthly revenue (MRR), annual revenue (ARR), download counts, paying-user share, scraped subscription pricing, in-app purchase tiers, ad-revenue mix and growth signals - useful for competitor benchmarking, market sizing and validating a new app idea.
Can I estimate App Store and Play Store downloads, MAU and paying users? ⌄
Yes. For Android we use the install range Google publishes (1M+, 10M+, 100M+). For iOS, Apple does not expose App Store install counts, so we estimate downloads from ratings volume × the standard industry ratio. Both are paired with monthly active users (MAU), daily active users (DAU) and an estimated paying-user count.
How does Rev.now estimate revenue, IAP earnings and subscription revenue? ⌄
Revenue ≈ (estimated downloads) × (active user share) × (category ARPU benchmark) × (developer share after the 15–30% Apple/Google store cut). For subscription apps we layer in scraped subscription pricing × paying-user conversion rate. For IAP-heavy apps we use the detected in-app purchase tiers. For paid apps it's simpler: downloads × price × dev share. Ad revenue uses MAU × eCPM × impressions per session.
Does Rev.now save my searches or require an account? ⌄
No account, no email, no tracking. Searches happen in real time, results render directly to the URL and you can copy/share that URL freely. Recently-checked feed on the homepage is in-memory only and rotates every few hours.
Can I share or embed an app revenue estimate? ⌄
Yes - every app gets a permanent SEO URL like /app/ios/[slug]/ or /app/android/[slug]/. Copy the link from the address bar to share, embed in a slide, drop in a Twitter thread or paste into a competitor analysis doc. Open Graph images render automatically for social previews.
Why are iOS and Android revenue different for the same app? ⌄
Apple and Google take different store cuts (15–30%), iOS users convert to paying users at 2–3× the Android rate, IAP pricing differs by store, and Google Play sells in regions with lower ARPU. Same app - very different App Store revenue vs Play Store revenue economics.
Can I see top grossing apps, top free apps and top paid apps? ⌄
Yes. The /leaderboard/ section has live App Store and Google Play charts: top grossing, most downloaded, top free, top paid, top subscription apps - filterable by category and country. Every leaderboard ranks apps by estimated monthly revenue or downloads.
What is the Opportunity Score on each app page? ⌄
Opportunity Score (0-100) flags apps making real money but with weak ratings, dated UI or thin features - clone-and-improve targets for indie founders. It combines revenue density, rating gap, complaint volume and category competition. Higher score = better study target.
Does Rev.now cover games and category-specific apps? ⌄
Yes - games, fitness, finance, dating, education, productivity, social, shopping, travel and every other category. Browse leaderboards by category, by country or use the niche explorer for AI calorie trackers, sleep apps, meditation, language learning, budget planners and 30+ other niches.
Why does Rev.now show a revenue range instead of one number? ⌄
Because honest modeling has uncertainty. We show low/mid/high confidence bands so you can use the right number for your use case - low for conservative pitches, mid for benchmarking, high for upper bound estimates.